A&D Weighing, SV-100, SV Series Sine-wave Vibro Viscometer, 10 P ~ 1000 P
Newly developed Tuning-fork Vibration Method promises high accuracy and wide measurement range without replacing sensor plates! (Patent pending)
Includes
- Manual
- AC Adaptor
- CD-ROM (WinCT-Viscosity)Sample Cups
- RS-232C Cable (25 pins - 9 pins)
Features
- High Measurement Accuracy
- Wide Measurement Range
- Non-Newtonian Sample Viscosity Measurement
- Foam Sample Measurement
- Flowing Sample Measurement
WinCT Viscosity
Via an RS232C interface, the WinCT-Viscometer software lets A&D's SV series Sine-wave Vibro Viscometer display measurement progress in real time on a PC, and easily transmit the measured results to save or analyze. The WinCT-Viscometer CD-ROM is a standard accessory with the SV Series viscometer.
RsVisco, the graphing software utilized by WinCT-Viscometer, lets you create graphs of measured results and of the progress of viscosity measurement:
1. RsVisco creates the real-time graph of data received from A&D's SV-series viscometer via RS-232C. RxVisco lets you graphically monitor in real time:
- Progress of change in viscosity during measurement
- Temperature data
- Temperature and viscosity, graphed together
2. You can choose from three types of graphs:
- Viscosity (Y axis) - Time (X axis)
- Viscosity/Temperature (Y axis) - Time (X axis)
- Viscosity (Y axis) - Temperature (X axis)
3. Graphs can be overlaid in repeating measurements, in 10 colors.
4. Measured data can be saved in a CSV format file.
5. Displayed graphs can be printed with a printer via a PC.
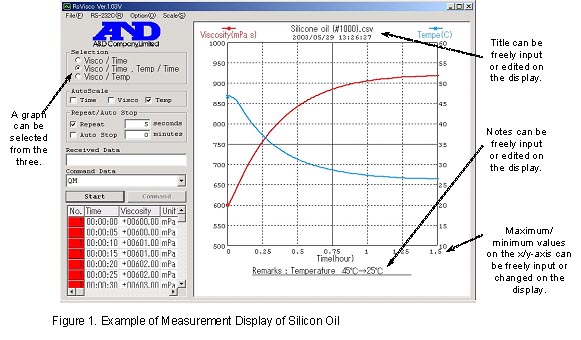
Example of Measurement Display Using RsVisco
(1) Example of RsVisco Display
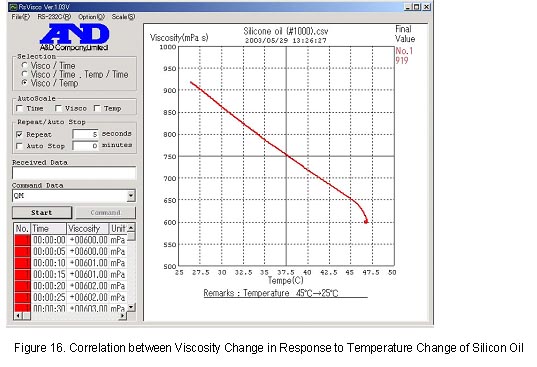
RsVisco software reads the measured results (CSV file) and creates a graph representing the measuring viscosity in real-time, as shown in the figures below. Figures 1 and 2 show the graphs representing viscosity changes of silicon oil (a Newtonian fluid) measured at room temperature while leaving it cooling down from about 45°C to 25°C. Figure 1 shows the elapsed time plotted along the x-axis, with the viscosity (left) and temperature (right) plotted along the y-axis. Figure 2 presents the same data by plotting the temperature along the x-axis and the viscosity along the y-axis. These graphs ideally present the linearity of the correlation between changes in viscosity in response to changes in temperature.